PFG/Diffusion Liquids Z Gradient Probes-Pulsed Field Gradient Coils 0ver 3,300 G/cm (33 T/m)
|
|
For Information on Diffusion Techniques: |
 We have a new model of our PFG probe that can extend sample
 Highest Efficiency, Ultra-Shielded, Fastest Switching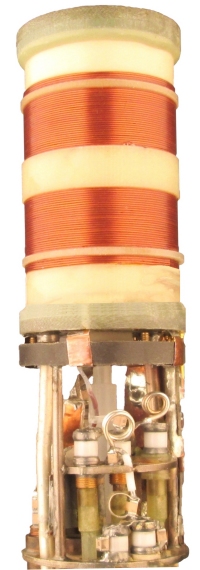
- Measure the lowest diffusion coefficients — to 10-15 m2/s
- Minimal eddy currents
- Highest strength gradients
- Best thermal stability
- Highest mechanical stability
- Largest sample region with 1% gradient uniformity
- Excellent spectral resolution
- 1H/X, direct or indirect
- For fields up to 900 MHz
Which gradient coil is preferred for most NB applications? The 20-40C allows a longer sample region than the 16-38 and shims a little better, so it permits higher S/N but requires a larger gradient amplifier. Both coils are widely used.
Specifications
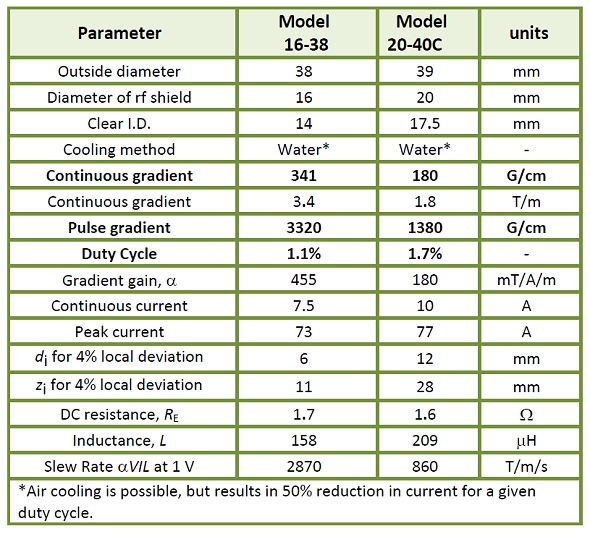
Local deviation (or differential linearity) is defined as the rms deviation from the mean gradient over the specified diameter, di, and length, zi, of the cylindrical sample region. Eddy currents from the internal RF shield are negligible. The gradient slew rate GS is the instantaneous rate of change in gradient when a 1 V step is applied. The continuous current ratings are true continuous ratings for a single axis with no time limit and adequate cooling.* One can use air cooling, but with a 50% reduction in current for a given duty cycle.
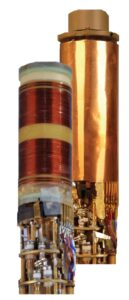
Doty Diffusion probe used to perform Oscillating Gradient Spin Echo (OGSE)
Results obtained with a Doty 300 MHz diffusion probe with a model 16-38 Z gradient
We wish to thank Junzhong Xu and Prof. John Gore at Vanderbilt Univ., Nashville, TN, for sharing their NMR results.
(For more information on this work click here.)
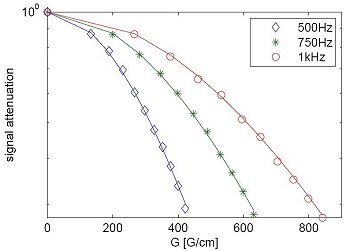
Figure 1. Experimental (markers) and fitted (lines) signal attenuation as a function of diffusion gradient amplitudes and frequencies
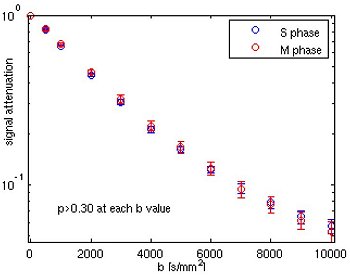
Figure 2. Signal attenuation obtained by PGSE measurements of two synchronized cell samples with b values up to 10,000s/mm2
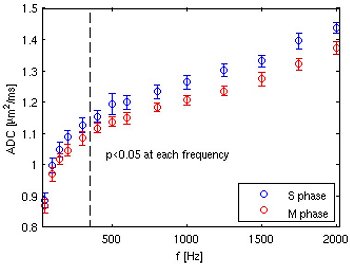
Figure 3. Dispersion curves (ADC vs f) of two types of synchronized cells. Error bars show standard deviations of all six samples.
