NMR SNR following a 90-degree Pulse at Thermal Equilibrium
The SNR applet allows you to compare the signal-to-noise ratio and other performance values of any well-tested probe to a comparable DSI probe. We have data for several probe types (solids and liquids), samples, and nuclei. The SNR applet works in two stages. In the calibration stage, it calculates the coil and circuit performance (ηfηeQL) of each probe based on experimental data. In the calculation stage, a new sample and other conditions are assigned to both probes. The applet calculates the new ηfηeQL, the new pulse power, and the signal-to-noise ratio for each probe.
The calibration data need not be for the field, nuclide, sample size, pulse length, or temperature for which you’d like to see SNR calculated. The applet knows how to scale appropriately, assuming the probe circuit for the field and sample of interest is similar to the one for which you (or we) have calibration data. For example, we don’t list data for the Bmax at 700MHz, but that’s okay. Use the Bmax data at 500 MHz. It will be scaled quite accurately for the field entered later for SNR calculation. Perhaps you have data for an E-free or T3 probe at 400 MHz, and want to see how one would perform at 600 MHz. Enter the data you have. It will be scaled appropriately.
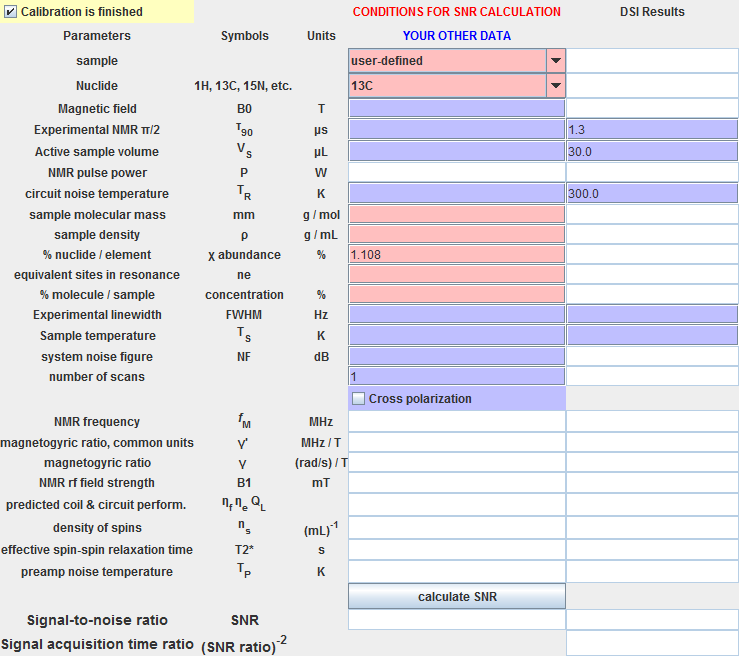
Calibration Stage
Choose a DSI probe from the list under “DSI calibration and product name”. Information about the results from the probe’s calibration is displayed in the second column.
Some probes can operate in two very different modes. For example, the Bmax can operate as H/X or as H/X/Y. The same is true for the new JRI-Doty MAS probes. To get the correct results, select calibration data from the list for the mode of interest (H/X or H/X/Y) and the channel of interest (1H, MF, or LF).
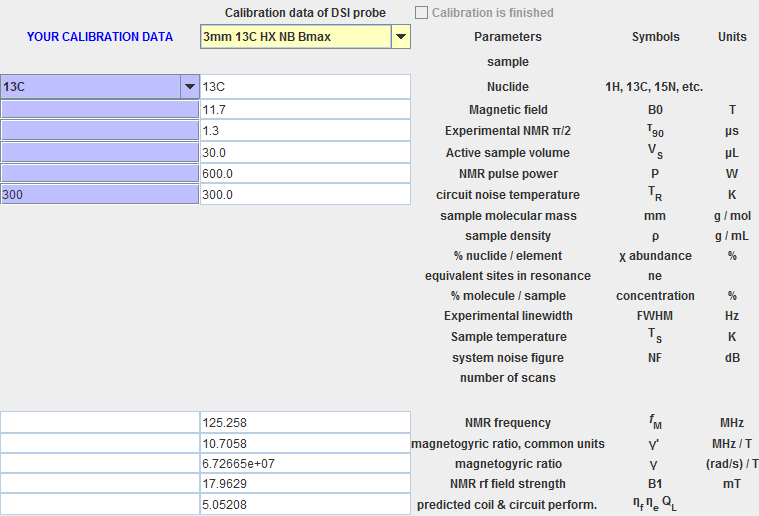
Enter the results of the calibration of your probe into the blue cells.
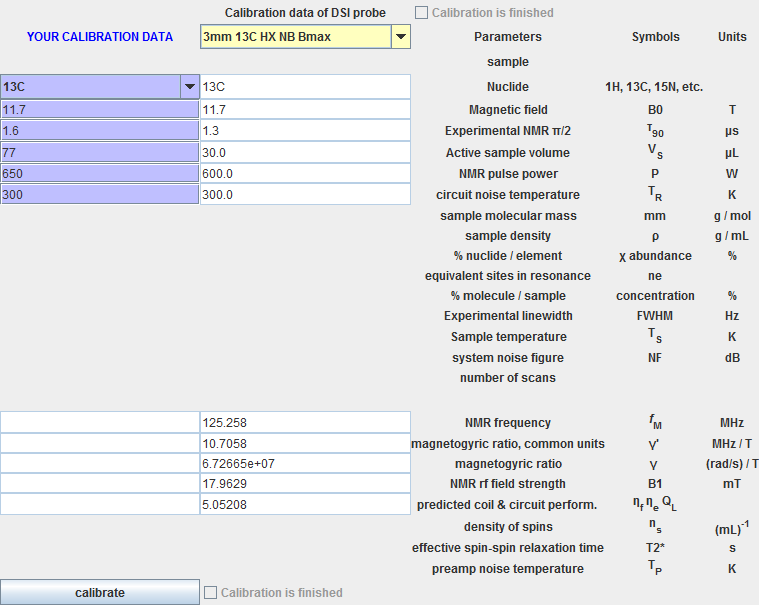
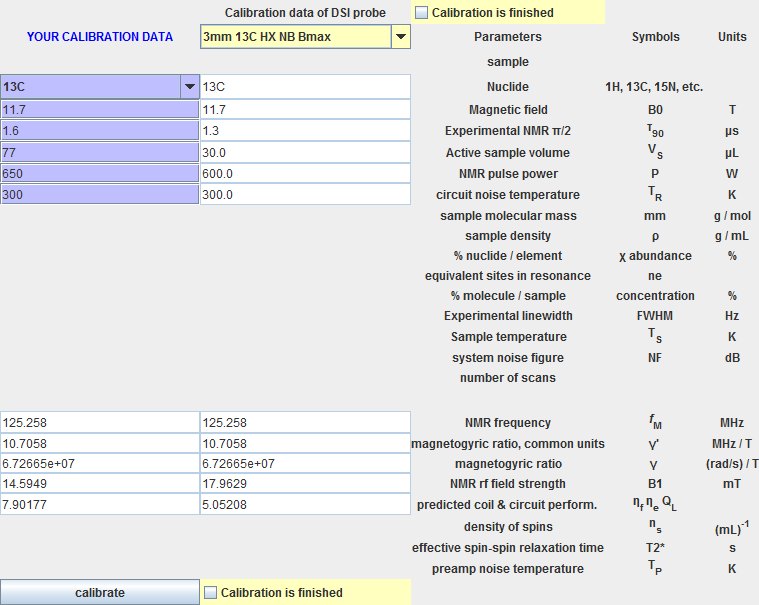
Press the “calibrate” button in the bottom left corner. From your calibration data, the NMR frequency, magnetogyric ratio, NMR rf field strength, and coil and circuit performance are calculated and displayed in the left column. If you accidentally entered an incorrect datum into a blue cell, you can replace it with the correct value and click “calibrate” again. The two probes can be calibrated in either order.
SNR Calculation Stage
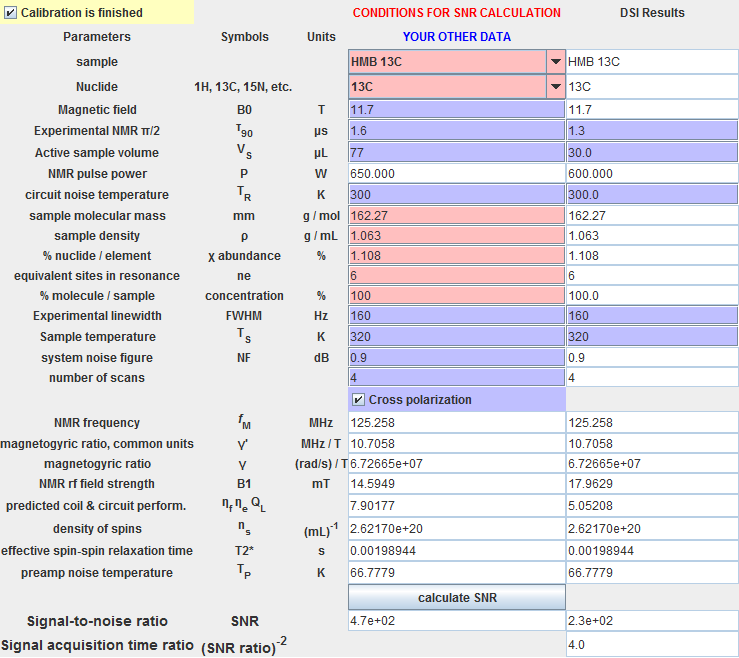
When the calibration data has been analyzed for both probes, the check boxes labeled “Calibration is finished” become yellow. If you click one of them, the first two columns become dormant and the right two columns become active. Now the applet is in the SNR calculation stage.
Enter the information about the new test conditions into the blue cells. When you select a nuclide, the “% nuclide / element” cell defaults to the natural abundance. You can choose a sample from the list to assign default values to the red cells. Then change the numbers in the red cells to whatever is true for your experiment. The pulse power is not an input variable in the SNR calculation stage and will be recalculated from the calibration results and the new input. If you don’t know the new value of τ90, a default value of (old τ90 * old fM / new fM) can be used.

Click the “calculate SNR” button. A new value of ηfηeQL is calculated for each probe based on the calibration results and the new values of TR and fM. A new NMR pulse power is calculated for each probe based on ηfηeQL and the new data. Then a new SNR is calculated for each probe.
Other Things to Consider
The white cells are for output only. The numbers in the red cells and three of the blue cells are just copied to the fifth column when you click “calculate SNR.”
In the example shown here, the SNR was calculated under the same experimental conditions as the calibration. If the margin of error of the input values is a factor of 1.1 (10%), the margin of error of the SNR will be a factor of about 1.30 – 1.35 (30% – 35%), depending on the assumptions made about the shapes of the error probability distribution functions. If the SNR is calculated under different experimental conditions, its margin of error is a factor of about 1.41 – 1.45 (41% – 45%).
If “Cross polarization” is checked, the SNR is multiplied by the magnetogyric ratio of 1H and divided by the magnetogyric ratio of the nuclide being measured. If the nuclide is 13C, the SNR will be multiplied by (42.5780/10.7058). This assumes the cross polarization is perfect. In practice, the SNR will be a factor of 1.0 – 1.3 smaller than what the applet reports for 13C.
